CDP Data Center Console allows you to monitor parameters of Disk Safes on multiple CDP Servers at once. You can do so from the "Disk Safes" screen.
Follow the instructions below to access the "Disk Safes" screen.
1. Select "Disk Safes" from the Main Menu.
You will enter the "Disk Safes" screen.
The "Disk Safes" List
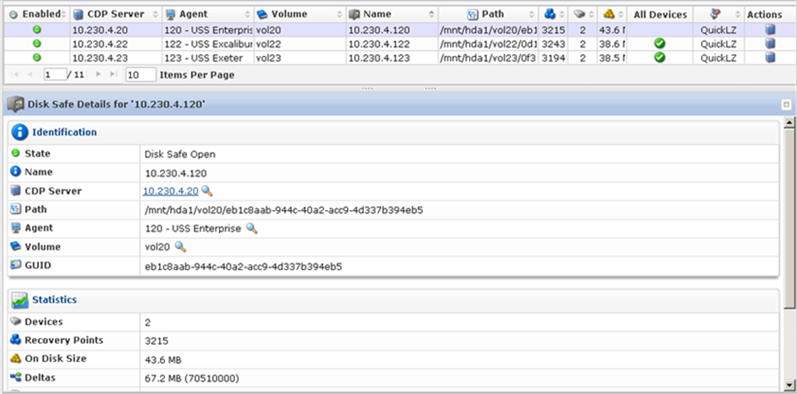
The list of all Disk Safes is displayed with the following columns:
- Enabled - Graphically indicates the Disk Safe state. If the icon is green, then the Disk Safe is opened. The red icon is used for closed Disk Safes.
- CDP Server - The name of the CDP Server to which the current Disk Safe belongs.

Note
The server name displays in the form of a link. You can click the link for quick access to the CDP Server.

- Agent - Displays the name of the Agent to which the Disk Safe is assigned.
- Volume - Displays the name of the Volume to which the Disk Safe is assigned.
- Name - Displays the name of the Disk Safe.
- Path - This column displays the path to the folder where the Disk Safe is physically located.
- Recovery Points - Displays the number of Recovery Points in the Disk Safe.
- Devices - Displays the number of Devices assigned to the Disk Safe.
- On Disk Size - Displays the disk space occupied by the Disk Safe.
- All Devices - Indicates if all Host's Devices are assigned to the Disk Safe. If the "All Devices" option was selected for the Disk Safe, then there is a green icon in this column. Otherwise, there will be no icon.
- Compression - Displays the compression level set for the Disk Safe. Possible values: "ZLib Low," "ZLib Medium," "ZLib High," "NONE."
- Actions - The following actions are available (see Editing Disk Safes for detailed description):
- Edit
- Stop
- Close
- Remove
- Delete
This column also contains the  icon. Clicking this icon will allow you to "drill down" to the specified CDP's "Disk Safes" screen.
Filtering the "Disk Safes" List
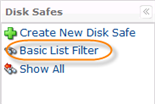
You can use a Basic List Filter to sort the "Disk Safes" list. Click on the "Basic List Filter" button to access the filtering options.
1. Select the necessary options to filter.
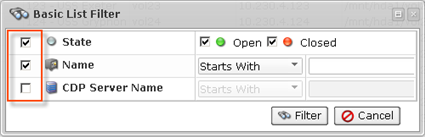
- State- Allows you to sort by the Disk Safe state (opened or closed).
- Name - Allows you to sort by the Disk Safe name.
- CDP Server Name - Allows you to sort by CDP Server name.
2. Select the type of search from the drop-down menu (Starts With/Contains/Ends With) and enter the Name//Server name to the field. Select whether to display "Opened" or "Closed" Disk Safes.
For example:
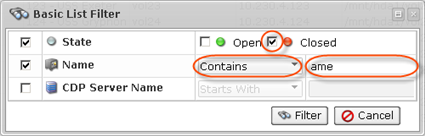
3. Click on the "Filter" button.

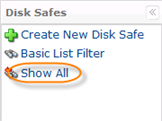
If you want to discard filtering options and view the whole list, click "Show all."
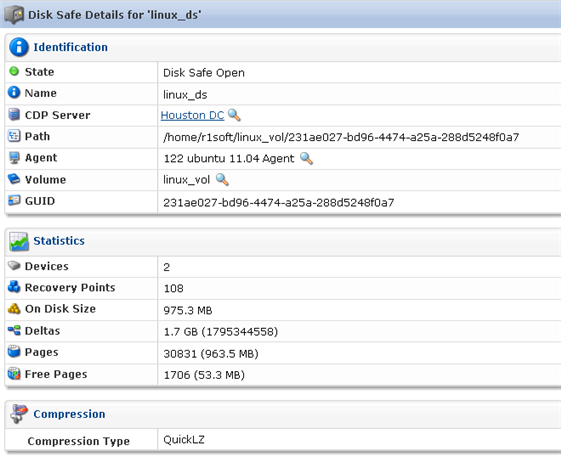
Details Pane
Click on a Disk Safe in the list to see its details in the "Details" pane. This pane provides more detailed information about the Disk Safe selected in the list. The pane has three sections:
- Identification
- Statistics
- Compression
Most of the information presented in these sections is the same as the data shown in the Disk Safes list columns (See above). Extra information is following:
- GUID - Globally Unique Identifier generated by the system.
- Deltas - The value in bytes. Deltas are the data that has changed since the last backup run.
- Pages
- Free Pages
- If you click on the
 icon near the CDP Server name, you will access the server details window.
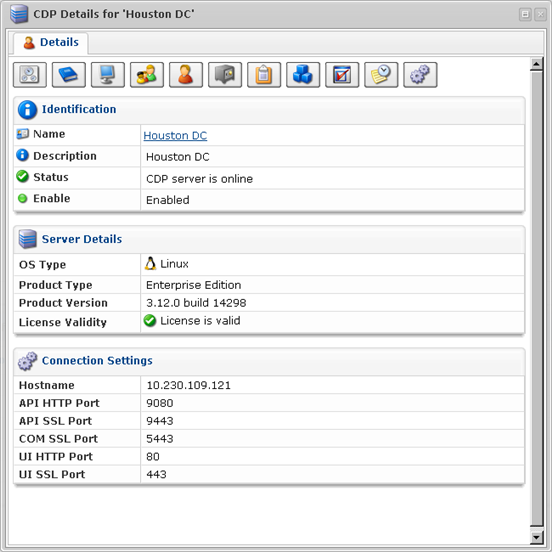
For more information about server details, see Accessing CDP Servers in Data Center Console.
- If you click on the icon near the Agent name, you will access the Agents Details window.
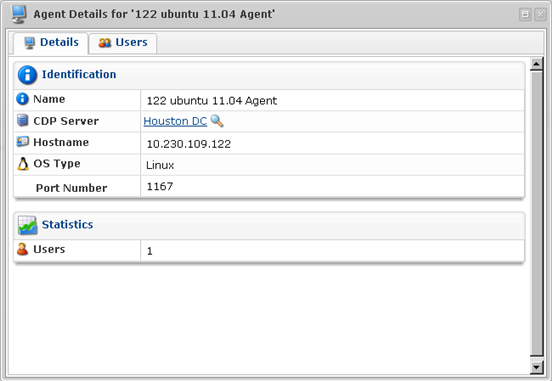
For more information about Agent details, see Monitoring Agents in Data Center Console.
- If you click on the icon near the Volume name, you will access the Volumes details window.

For more information about Volume details, see Monitoring Volumes in Data Center Console.