CDP Data Center Console allows you to monitor parameters of Policies on multiple CDP Servers at once. You can do so from the "Policies" screen.
Follow the instructions below to access the "Policies" screen.
1. Select "Policies" from the Main Menu.
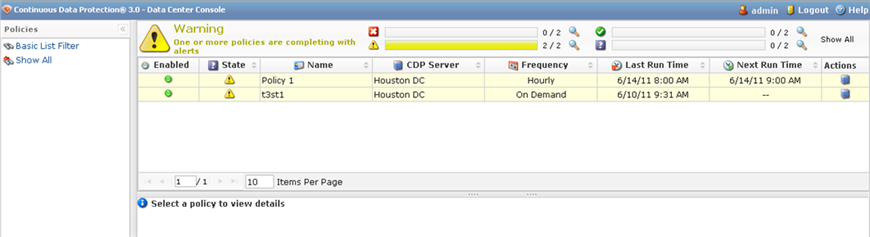
You will enter the "Policies" screen.
The "Policies" List
The list of all Policies is displayed with the following columns:
- Enabled - Graphically indicates the Policy status ("Enabled" or "Disabled"). If the icon is green, then the Policy is enabled. The red icon is used for disabled Policies.
- State - Graphically indicates the Policy state. For more information about Policy states, see Using Data Center Console Dashboard.
- Name - The name of the Policy.
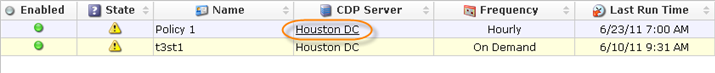
- CDP Server - The name of the CDP Server to which the current Policy belongs.

Note
The server name is displayed in the form of a link. You can click the link for quick access to the CDP Server.
- Frequency - Recurrence selected for running the Policy (On Demand, Minutely, Hourly, Daily, etc.).
- Last Run Time - Date and time when the Policy was started last time.
- Next Run Time - Date and time when the Policy will run next time according to the schedule.
- Actions - This column contains the
 icon. Clicking this icon will allow you to "drill down" to the specified CDP's "Policies" screen.
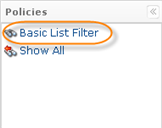
Filtering the Policies list
You can use a Basic List Filter to sort the Policies list. Click on the "Basic List Filter" button to access the filtering options.
1. Select the necessary options to filter.
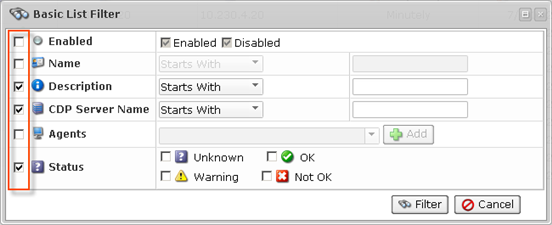
- Enabled - Allows you to sort by the state (enabled/disabled).
- Name- Allows you to sort by the Policy name.
- Description - Allows you to sort by the Policy description.
- CDP Server Name - Allows you to sort by the Server name.
- Agents - Allows you to sort by the Agents.
- Status - Allows you to sort by the Disk status.
- Unknown
- OK
- Warning
- Not OK
2. Select the type of search from the drop-down menu (Starts With/Contains/Ends With) and enter the Policy name//Server name/Description to the field. Select the status of Policy to show.
For example:
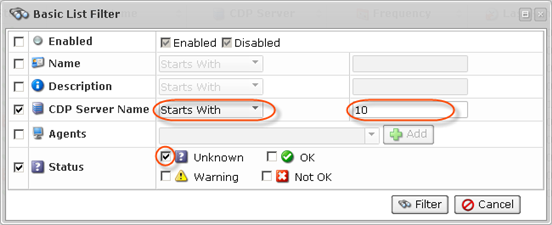
3. Click on the "Filter" button.

If you want to discard filtering options and view the whole list, click "Clear Filter."
Errors
If one or more Policies run with errors, the "Error" icon is displayed in the upper area with a table of Policies status.

The Errors tab displays the number of all Policies and the Policies that are in a particular state. There are four states:
 - Policies that are OK.
 - Policies that are completing with alerts.
 - Policies that are failing.
 - Policies that are in an unknown state.
Click on the "Detail" icon to sort the Policies list according to the state of a Policy, or click on "Show All" to show the list of all Policies.
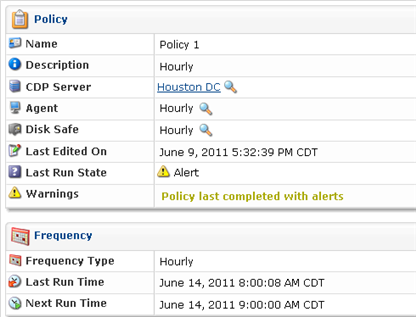
Details Pane
This pane provides more detailed information about the Policy selected in the list. Most of the information presented here is the same as the data shown in the Policies list columns. Extra information includes the following:
- Description
- Agent
- Disk Safe
- Last Edited On
- Last Run State
- If you click on the
 icon near the CDP Server name, you will access the server details window.
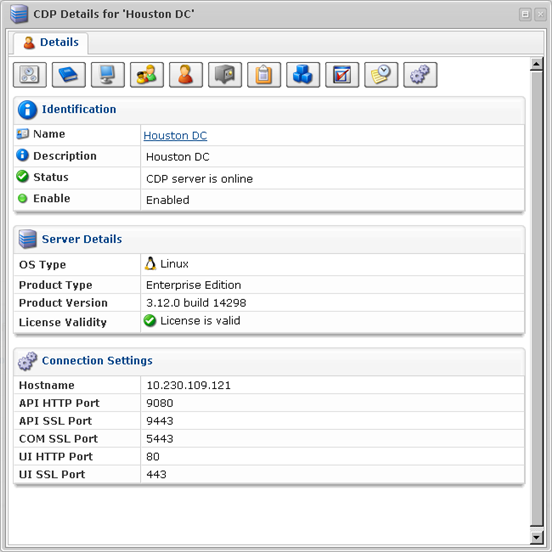
For more information about server details, see Accessing CDP Servers in Data Center Console.
- If you click on the icon near the Agent name, you will access the Agents details window.
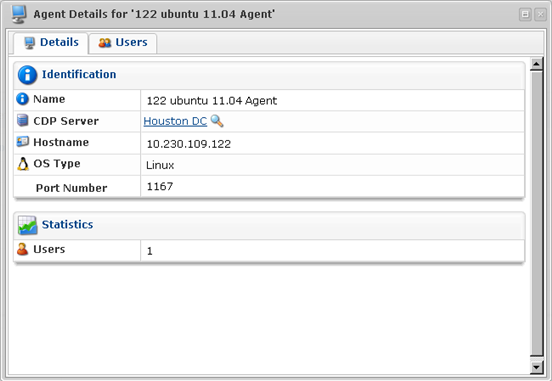
For more information about Agent details, see Monitoring Agents in Data Center Console.
- If you click on the icon near the Disk Safe name, you will access the Disk Safes details window.
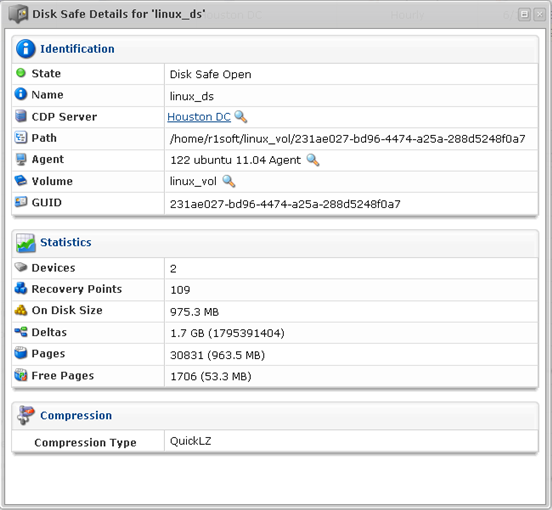
For more information about Disk Safe details, see Monitoring Disk Safes in Data Center Console.