Data Center Console allows you to monitor parameters of Policies on multiple Backup Managers at once. You can do so from the "Policies" screen.
Follow the instructions below to access the "Policies" screen.
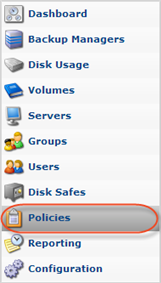
1. Select "Policies" from the Main Menu.
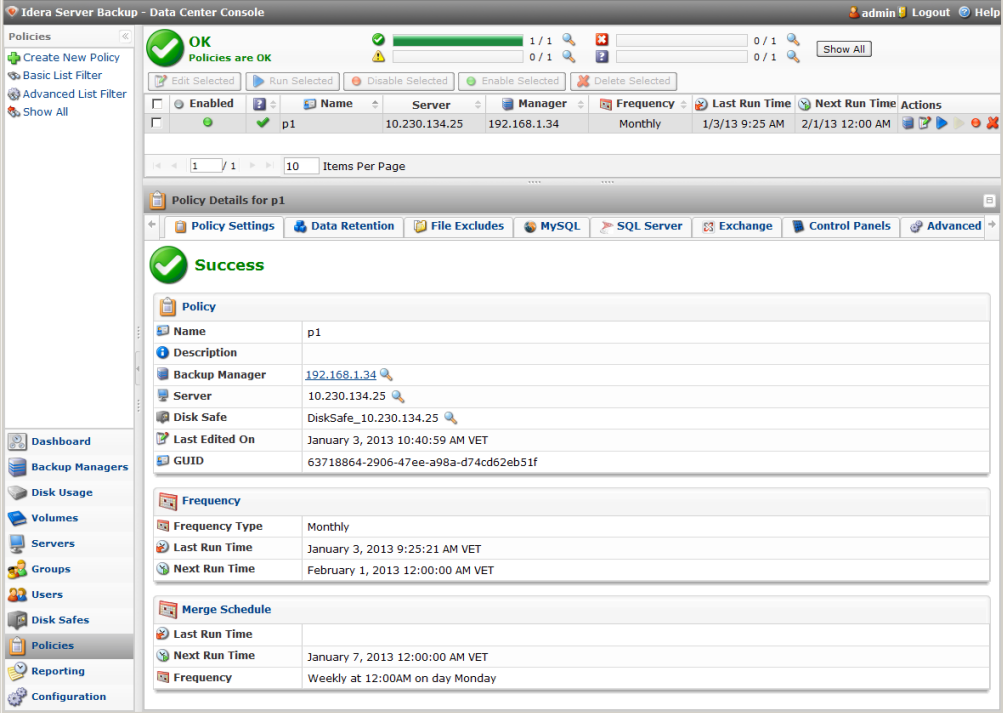
You will enter the "Policies" screen.
The "Policies" List
The list of all Policies is displayed with the following columns:
- Enabled - Graphically indicates the Policy status ("Enabled" or "Disabled"). If the icon is green, then the Policy is enabled. The red icon is used for disabled Policies.
- State - Graphically indicates the Policy state. For more information about Policy states, see Use Data Center Console Dashboard.
- Name - The name of the Policy.
- Server - The name of the Server to which the current Policy belongs.
- Manager - The name of the Backup Manager to which the current Policy belongs.

Note
The backup manager name is displayed in the form of a link. You can click the link for quick access to the Backup Manager.

- Frequency - Recurrence selected for running the Policy (On Demand, Minutely, Hourly, Daily, etc.).
- Last Run Time - Date and time when the Policy was started last time.
- Next Run Time - Date and time when the Policy will run next time according to the schedule.
- Actions - This column contains the list of actions that can be performed over the Policy. See the description below.
| Tip Use "Pages Navigation" to look through the "Policy" list more efficiently.  |
The Policies Actions
The Policies list contains the "Actions" pane.
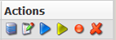
The following Actions are available:
| Icon | Action | Description |
|---|---|---|
 |
Open Backup Manager to view policies | Click this icon to "drill down" to the specified Backup Manager's "Policies" screen. |
 |
Edit | Click this icon to edit the Policy properties. See Edit policies in DCC. |
 |
Run now | Click this icon to run the selected policy. See Run policies. |
 |
Archive now | Click this icon to create the archiving Policy. See Create archiving policies. |
 |
Disable | Click this icon to disable selected Policy. See Disable policies. |
 |
Delete | Click this icon to delete the Policy from the Console. See Delete policies. |
You can perform some of the actions on several Policies at once by selecting them from the list using checkboxes and clicking the corresponding button at the top.
- Edit Selected
- Run Selected
- Disable Selected
- Enable Selected
- Delete Selected
See the descriptions of these actions in the table above.
Filtering the Policies list
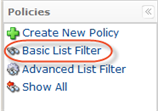
Basic List Filter
You can use a Basic List Filter to sort the Policies list. Click on the "Basic List Filter" button to access the filtering options.
1. Select the necessary options to filter.
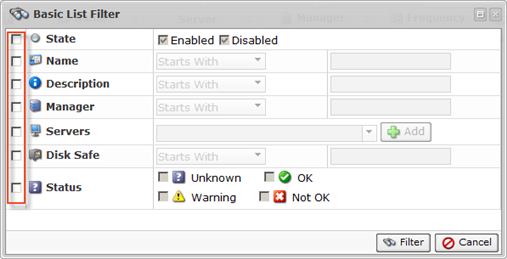
- State - Allows you to sort by the state (enabled/disabled).
- Name- Allows you to sort by the Policy name.
- Description - Allows you to sort by the Policy description.
- Manager - Allows you to sort by the Backup Manager name.
- Servers - Allows you to sort by the Servers.
- Disk Safe - Allows you to sort by the Disk Safe.
- Status - Allows you to sort by the Disk status.
- Unknown
- OK
- Warning
- Not OK
2. After the options are selected, click on the "Filter" button.

| Tip Click the "Show all" link to see the whole Policies List. |
Advanced List Filter
The Advanced List Filter allows you to reduce the number of Policies in the list on the basis of filter options (criteria).
Follow the instructions below to apply the Advanced Filter to the Policies list.
1. Click on "Advanced List Filter" located in the Policy sub-menu.
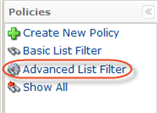
2. The "Advanced List Filter" window will open.
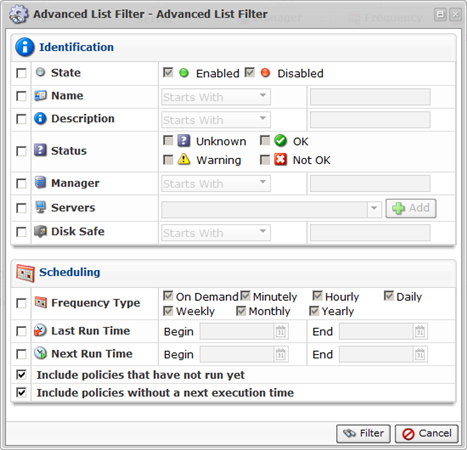
There are several blocks with filter options.
| Tip You can hide/open the filter options for every block by clicking on the header of the corresponding block. |
3. Define one or several filter options:
Identification
This block contains the same filter options as the Basic List Filter. See Basic List Filter above.
Scheduling
Contains the following options:
- Frequency Type - Select this check-box to display Policies on the basis of their schedule.
- On Demand
- Minutely
- Hourly
- Daily
- Weekly
- Monthly
- Yearly
| Note By default, all Frequency Types are checked and all Policies are displayed. |
- Last Run Time - Select this check-box to display Policies on the basis of the date when they run last time.
- Begin - Select the first date in the date range. Use the pull-down calendar or type in the required date. The Policies that started on this date and after will be displayed. Example: Nov 27, 2010.
- End - Select the last date in the date range. Use the pull-down calendar or type in the required date. The Policies that started on this date and before it will be displayed. Example: Nov 29, 2010.
- Next Run Time - Select this check-box to display Policies on the basis of the scheduled date of the next running.
- Begin - Select the first time in the time range. Use the pull-down calendar or type in the required date. The Policies started at this time and after it will be displayed. Example: Nov 27, 2010.
- End - Select the last time in the time range. Use the pull-down calendar or type in the required date. The Policies started at this time and before it will be displayed. Example: Nov 27, 2010.
- Include policies that have not run yet - Select this check-box to display Policies that have not been run yet and the "Last Execution Time" is not defined.
- Include policies without next execution time - Select this check-box to display Policies where the "Next Execution Time" is not defined, for example, with "On Demand" option selected.
4. Click on "Filter" to apply the filter to the "Policies" List.

| Tip Click the "Show all" link to see the whole Policies List.  |
Errors
If one or more Policies run with errors, the "Error" icon is displayed in the upper area with a table of Policies status.

The Errors tab displays the number of all Policies and the Policies that are in a particular state. There are four states:
 - Policies that are OK.
 - Policies that are completing with alerts.
 - Policies that are failing.
 - Policies that are in an unknown state.
Click on the "Detail" icon to sort the Policies list according to the state of a Policy, or click on "Show All" to show the list of all Policies.
Details Pane
This pane provides you with detailed information about the Policy selected in the list. The following tabs are available:
- Policy Settings
- Data Retention
- File Excludes
- MySQL
- SQL Server
- Exchange
- Control Panels
- Advanced Policy Settings

Policy Settings Tab
Most of the presented data is the same as the data shown in the "Policies" list columns. The following information is available:
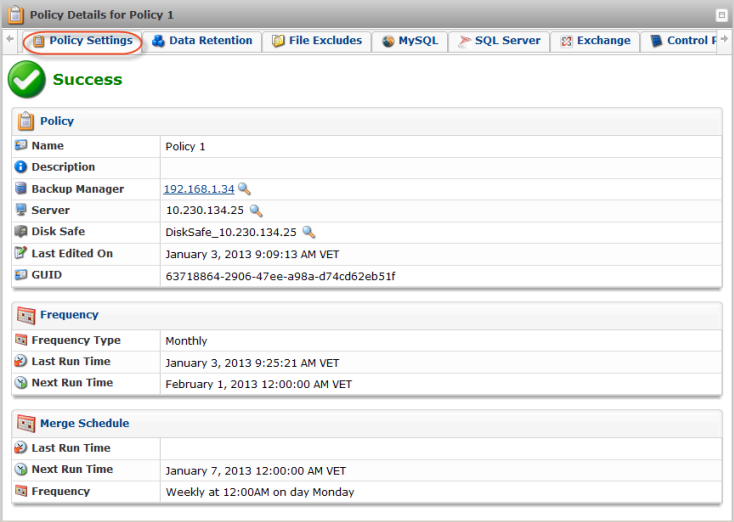
Policy
- Name - The unique name of the Policy.
- Description - Additional information about the Policy. This field is also unique.
- Backup Manager - The name of the Backup Manager.
- Server - The name of the Server.
- Disk Safe - The name of the assigned Disk Safe.
- Last Edited On - The date and time when the Policy was created or last edited.
- Errors- Displays a message if any errors appear.
- GUID- Identification number.
Scheduling
- Frequency Type - Displays the Replication Schedule of the Policy. See Schedule recovery point replication
- Merge Schedule - Displays the Merge Schedule of the Policy. See Schedule recovery point merges.
Tip
You can collapse/expand the details of the Disk Safe, Server or Backup Manager by clicking on the "Details" icon.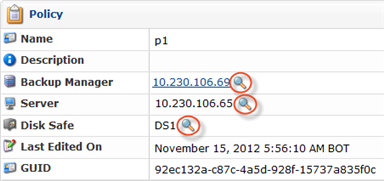
Data Retention Tab
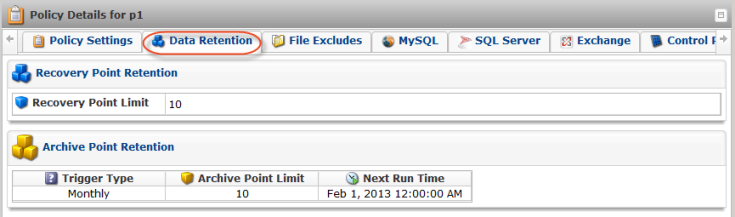
- Recovery Point Retention - Shows the Recovery Point Limit - the maximum number of stored Recovery Points. When the number is exceeded, the Recovery Points will be merged. See Merge recovery points.
- Archive Point Retention - Shows the Archiving Schedule. See Create archiving policies.
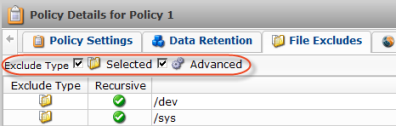
File Excludes Tab
Displays the "Files Excludes" rules for the selected Policy.
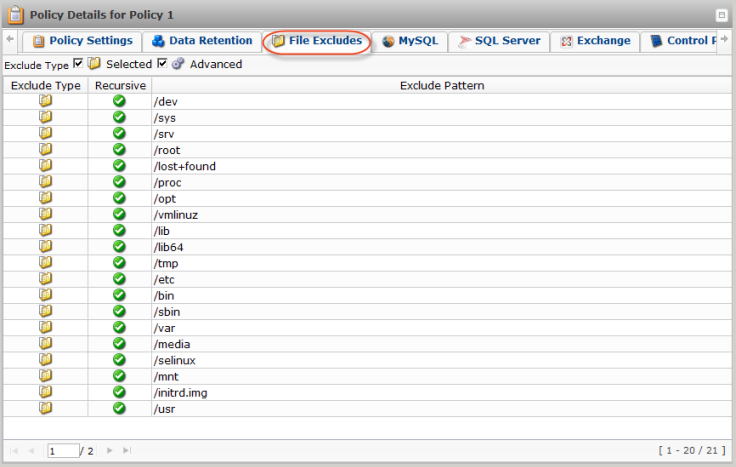
Columns:
- Exclude Type - Graphically shows a type of the Exclude rule:
- Selected - Shows files and folders that were selected to exclude in the "File and Folder Excludes" tab of the Policy window. See more in Exclude files and folders in DCC.
- Advanced - Shows advanced exclude rules that are defined in the "Advanced Excludes" tab of the Policy window to exclude files and folders on the basis of the mask ("pattern"). See more in Exclude files and folders in DCC.
- Recursive - If enabled, the exclude rule will be applied not only to the root folder files, but also to the files from sub-folders. Used only for advanced excludes.
- Exclude Pattern - Depending on the type, in this column you can see files and folders to exclude or exclude mask.
See also: Exclude files and folders in DCC.
| Tip You can filter the items shown on the tab by Exclude Type. Use the checkboxes at the top of the tab.
|
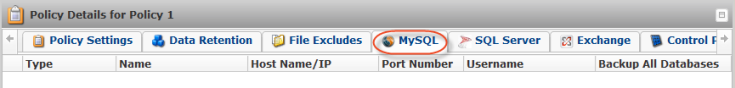
MySQL Tab
Displays the MySQL instances that are being replicated.
SQL Server Tab
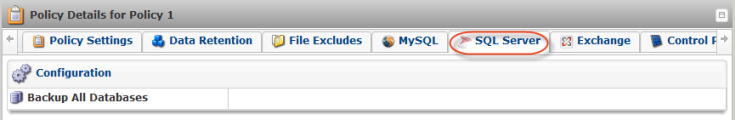
- Backup All Database - You may see here whether you have choosen to perform a backup or not.
Exchange Tab
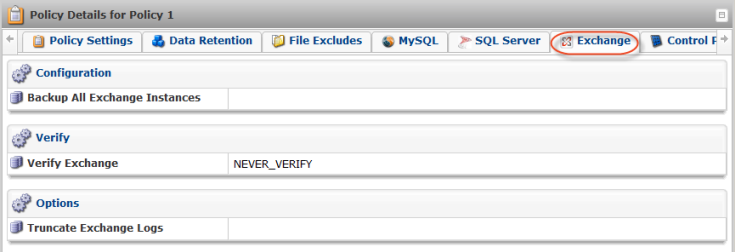
- Backup All Exchange Instances- Shows whether you have choosen to perform an Exchange backup or not.
- Verify Exchange- Shows one of the options chosen before:
- Never verify
- Always verify
- After every X successful backup
- Verify Exchange Frequency - Appears if you have choosen "Verify after every X successful backup" option before.
- Truncate Exchange Logs
Control Panels Tab
Displays the "Control Panel Instances" of the selected Policy.
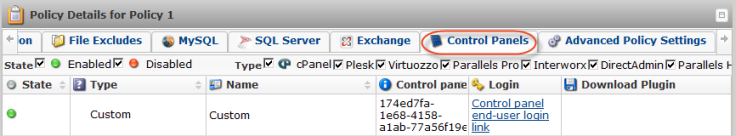
Columns:
- State - Current state of the Control Panel Instance. It can be defined as:
- Enabled - To display only enabled Instances.
- Disabled - To display only disabled Instances.
- Type - The type of the Control Panel Instance, which specifies what kind of control panel is being configured. It can be defined as:
- cPanel - To display Control Panel Instances of cPanel type.
- Plesk - To display Control Panel Instances of Plesk type.
- Virtuozzo - To display Control Panel Instances of Virtuozzo type.
- Parallels Pro - To display Control Panel Instances of Parallels Pro type.
- Interworx - To display Control Panel Instances of Interworx type.
- DirectAdmin - To display Control Panel Instances of DirectAdmin type.
- Parallels H-Sphere - To display Control Panel Instances of Parallels H-Sphere type.
- Linux Home Directories - To display Control Panel Instances of Linux Home Directories type.
- Custom - To display Control Panel Instances of Custom type.
- Name - The unique name of the Control Panel Instance.
- Control Panel Instance ID - The unique identification number of the instance.
- Login - Contains the link to the page to log in and get an access to the certain Control Panel data.
- Download Plugin
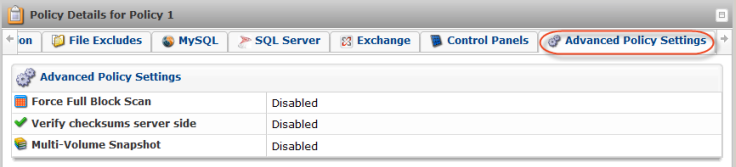
Advanced Policy Settings Tab
Displays the advanced settings of the selected Policy.